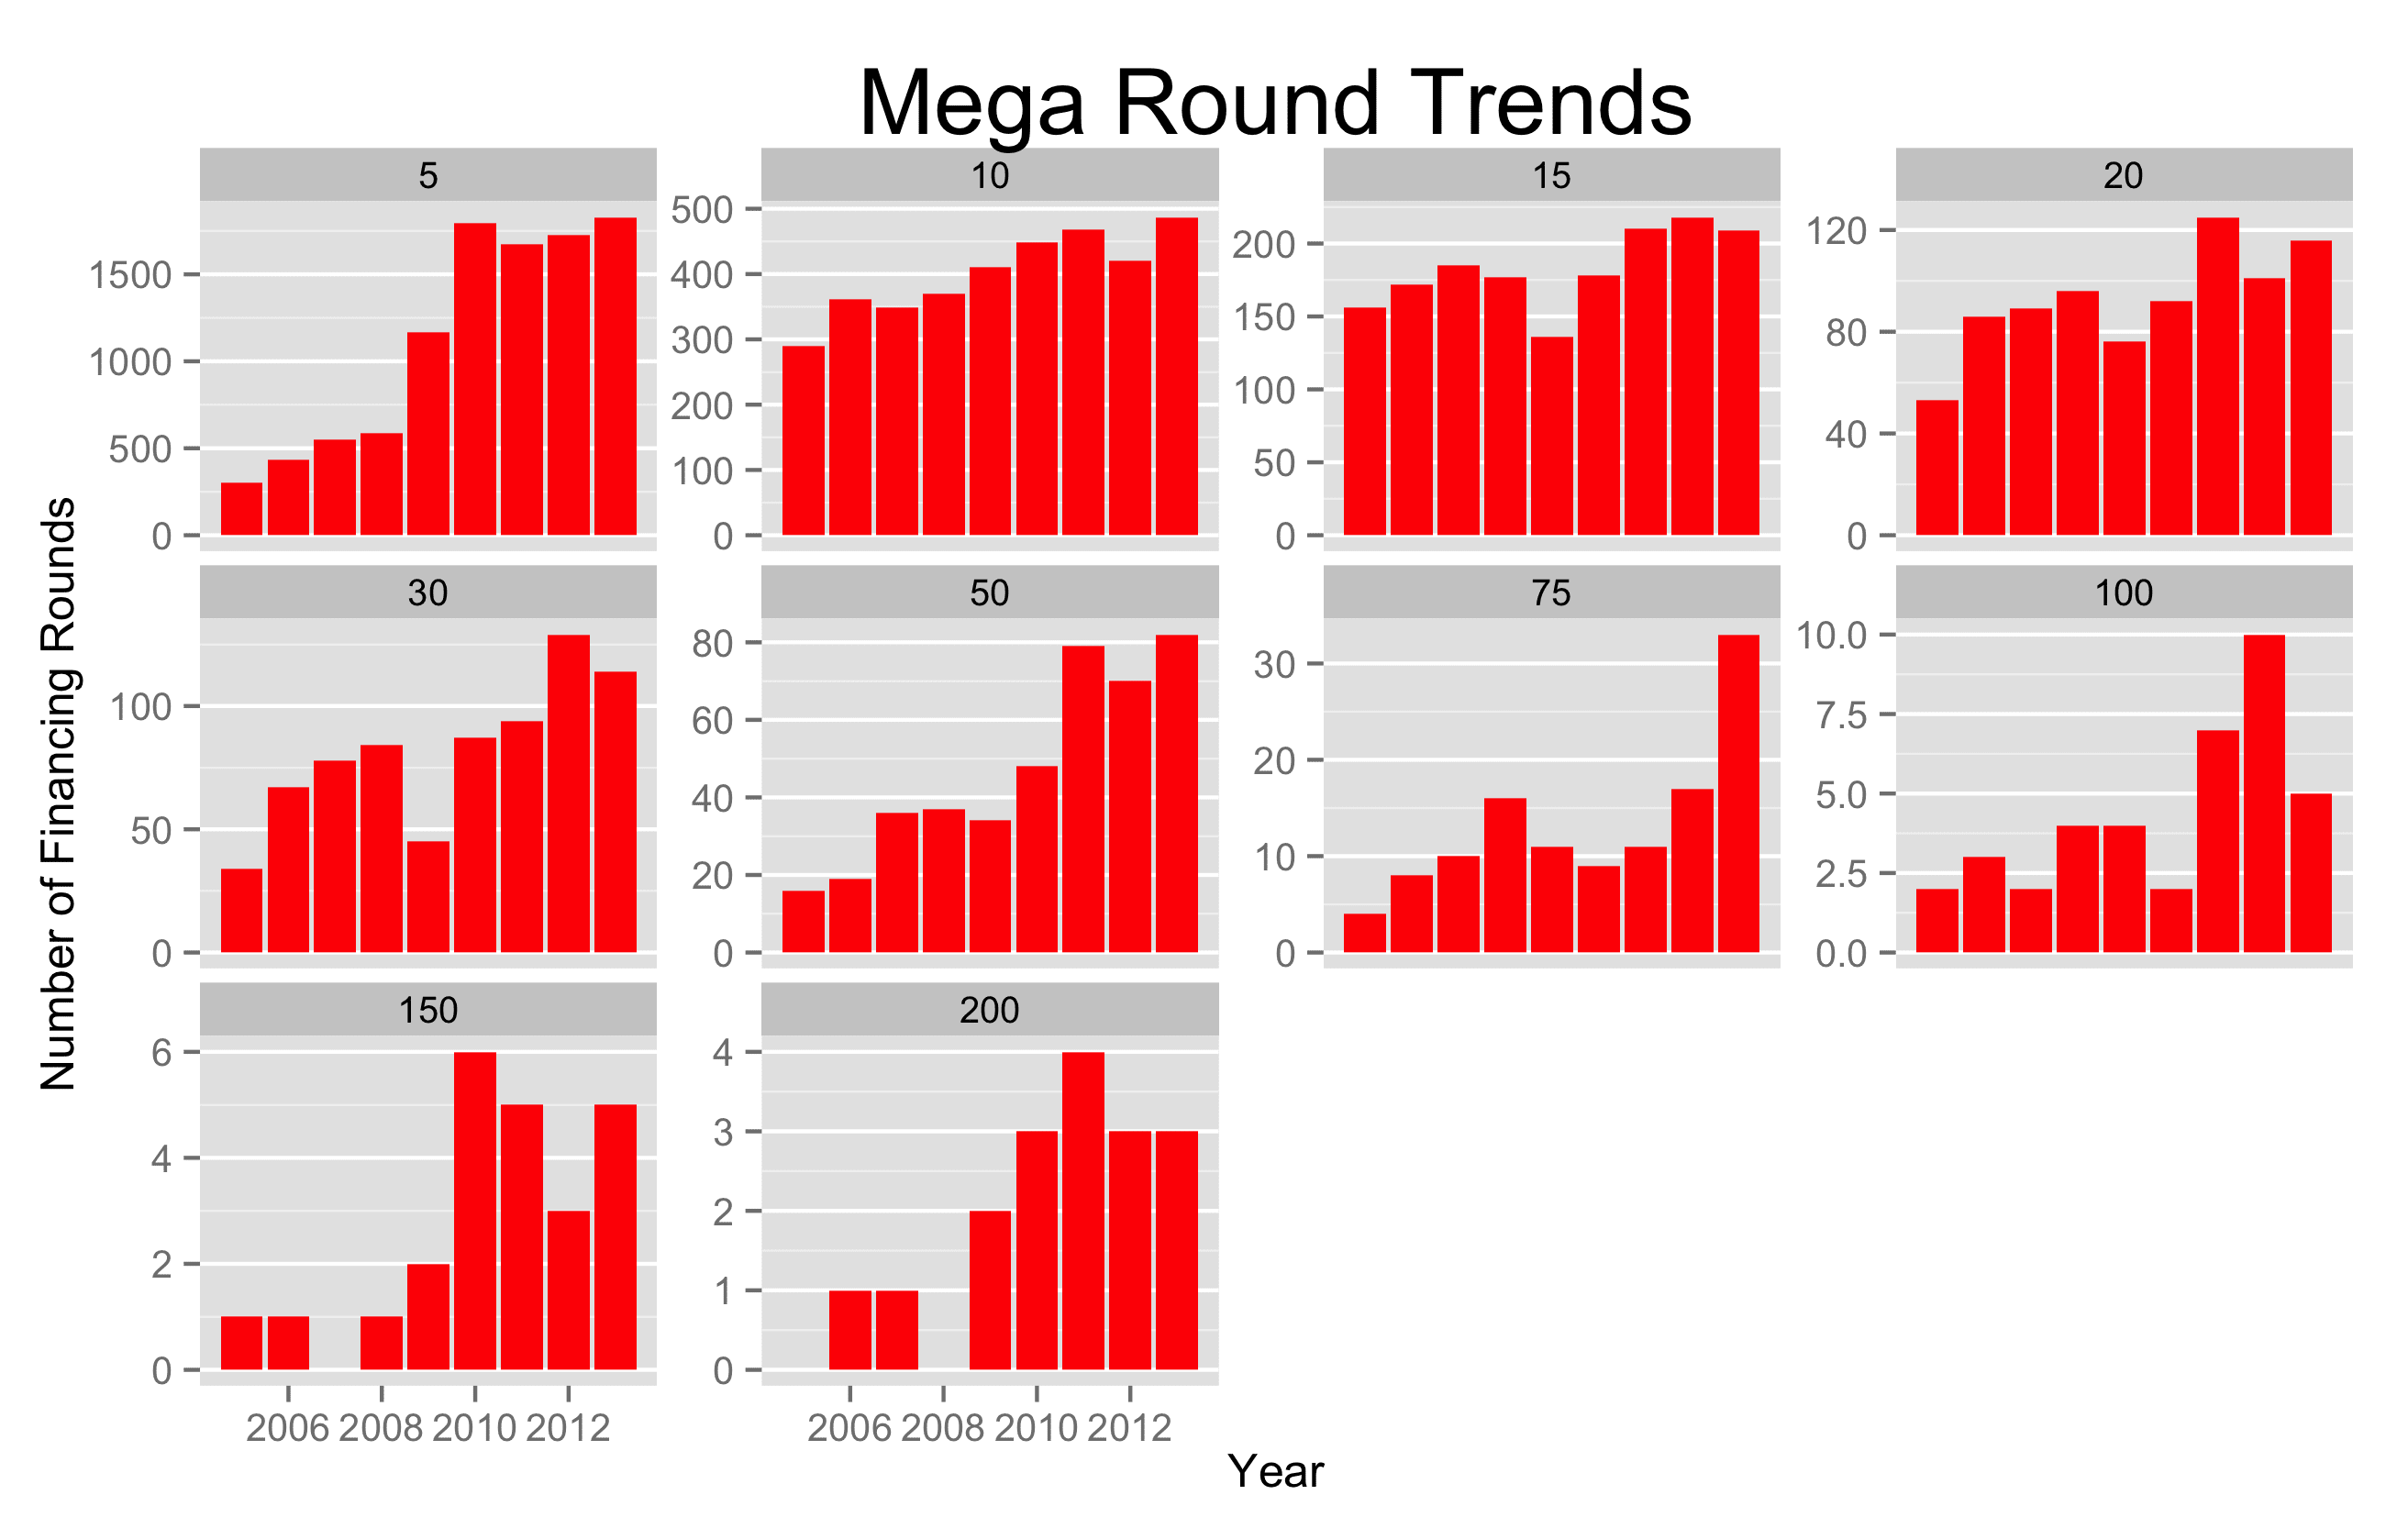
Why Startups Face Increasing Competition in Raising Series As and Bs
Analyze 917 startup funding trends: Why Series A/B rounds are getting more competitive, with only 27% of seed-stage companies securing follow-on investment.
Discover which startup sectors have the best odds of Series A success. Data shows 40% of search startups secure funding vs just 10% for hardware. Key trends revealed.
Discover how your startup's name impacts fundraising success. Data shows T-named startups raise 100% more in Series A rounds. Get data-driven insights for naming your company.
Data analysis reveals optimal seed round size: $600-900k increases Series A success rate by 33%. Key insights for startup founders on maximizing follow-on funding.
Analyzing 726 startups reveals surprising data: larger seed rounds don't reliably predict bigger Series A investments. Key insights for founders raising capital.
Analyze the optimal customer value strategy for SaaS startups with real IPO data. Key finding: Revenue per customer shows only 0.3 R² correlation with total revenue.
Learn how churn impacts startup growth: analyze maximum viable churn rates, capital requirements, and revenue tradeoffs for SaaS companies with real metrics and data.
Discover the optimal months for startup fundraising based on 15+ years of VC investment data. Learn when VCs are most active and how to time your raise.
Analyze 3 key startup exit trends: 7% annual value growth, flat exit volume, and 2x increase in IPOs. Data-driven insights from 10 years of venture capital exits.
Data analysis reveals tech company valuations dropped 67% since 1980s, from $4.3B to $1.4B, as market fragmentation reshapes the industry landscape.