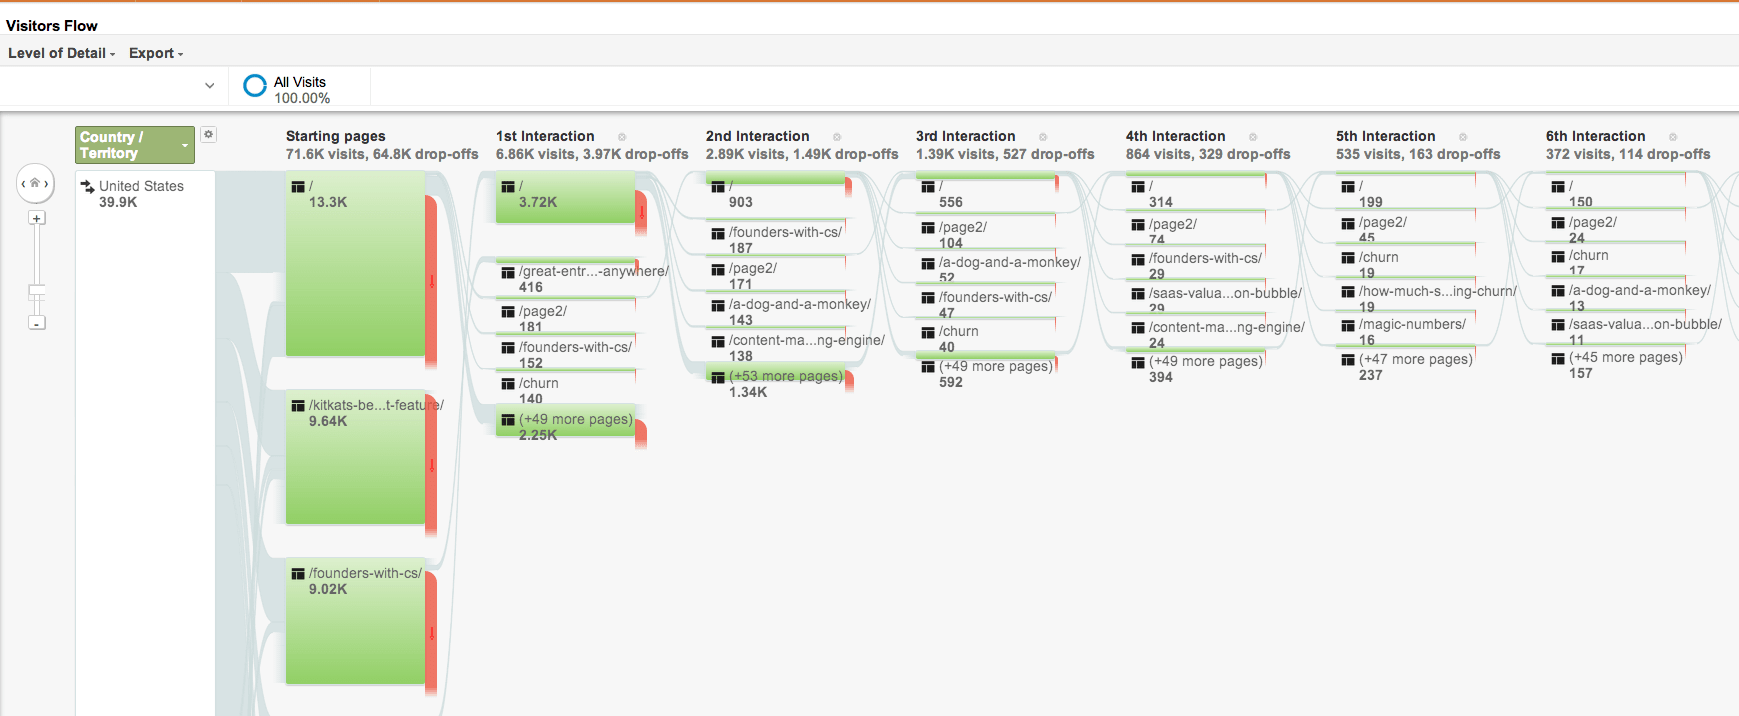
The Single Biggest Determinant of Startup Valuations at IPO
Discover why growth rate explains 50% of startup IPO valuations in 2013, while profitability shows zero correlation. Data analysis of 25 tech IPOs reveals key trends.
New data reveals post-Series A founder CEOs taking 24% less salary but 32% more equity. Analysis of 800 startups shows shifting compensation trends in venture-backed companies.
Explore how SaaS company valuations surged 200-400% in 2 years despite unchanged unit economics. Key insights on the growing valuation bubble in tech.
Learn how to maximize Twitter content marketing ROI through data-driven recirculation. Analysis shows posts gain 75% of original retweets with each reshare.
Data-driven analysis reveals the most effective content distribution channels for startups. Compare email vs RSS vs Twitter performance metrics to optimize your marketing strategy.
Discover how Simpson's Paradox reveals hidden truths in startup data analysis, illustrated through Berkeley's landmark discrimination case and acceptance rates.
Learn 3 essential cohort analysis methods to measure product performance: onboarding, longitudinal & cohort trends. Data-driven insights for SaaS startups.
Discover 6 essential SaaS benchmarks: Inside sales drives 40% faster growth, optimal pricing ranges, and key metrics to measure your startup's performance vs competitors.
Analyze 9 months of Twitter ad performance data: $2.9k spent, 1,650 followers gained at $1.73 CPF. Key insights on social media ROI for startups.
Analyzing seed funding data from 30+ billion-dollar startups reveals key patterns: 55% raised seed rounds, with 71% VC participation and 67% Series A follow-on rates.