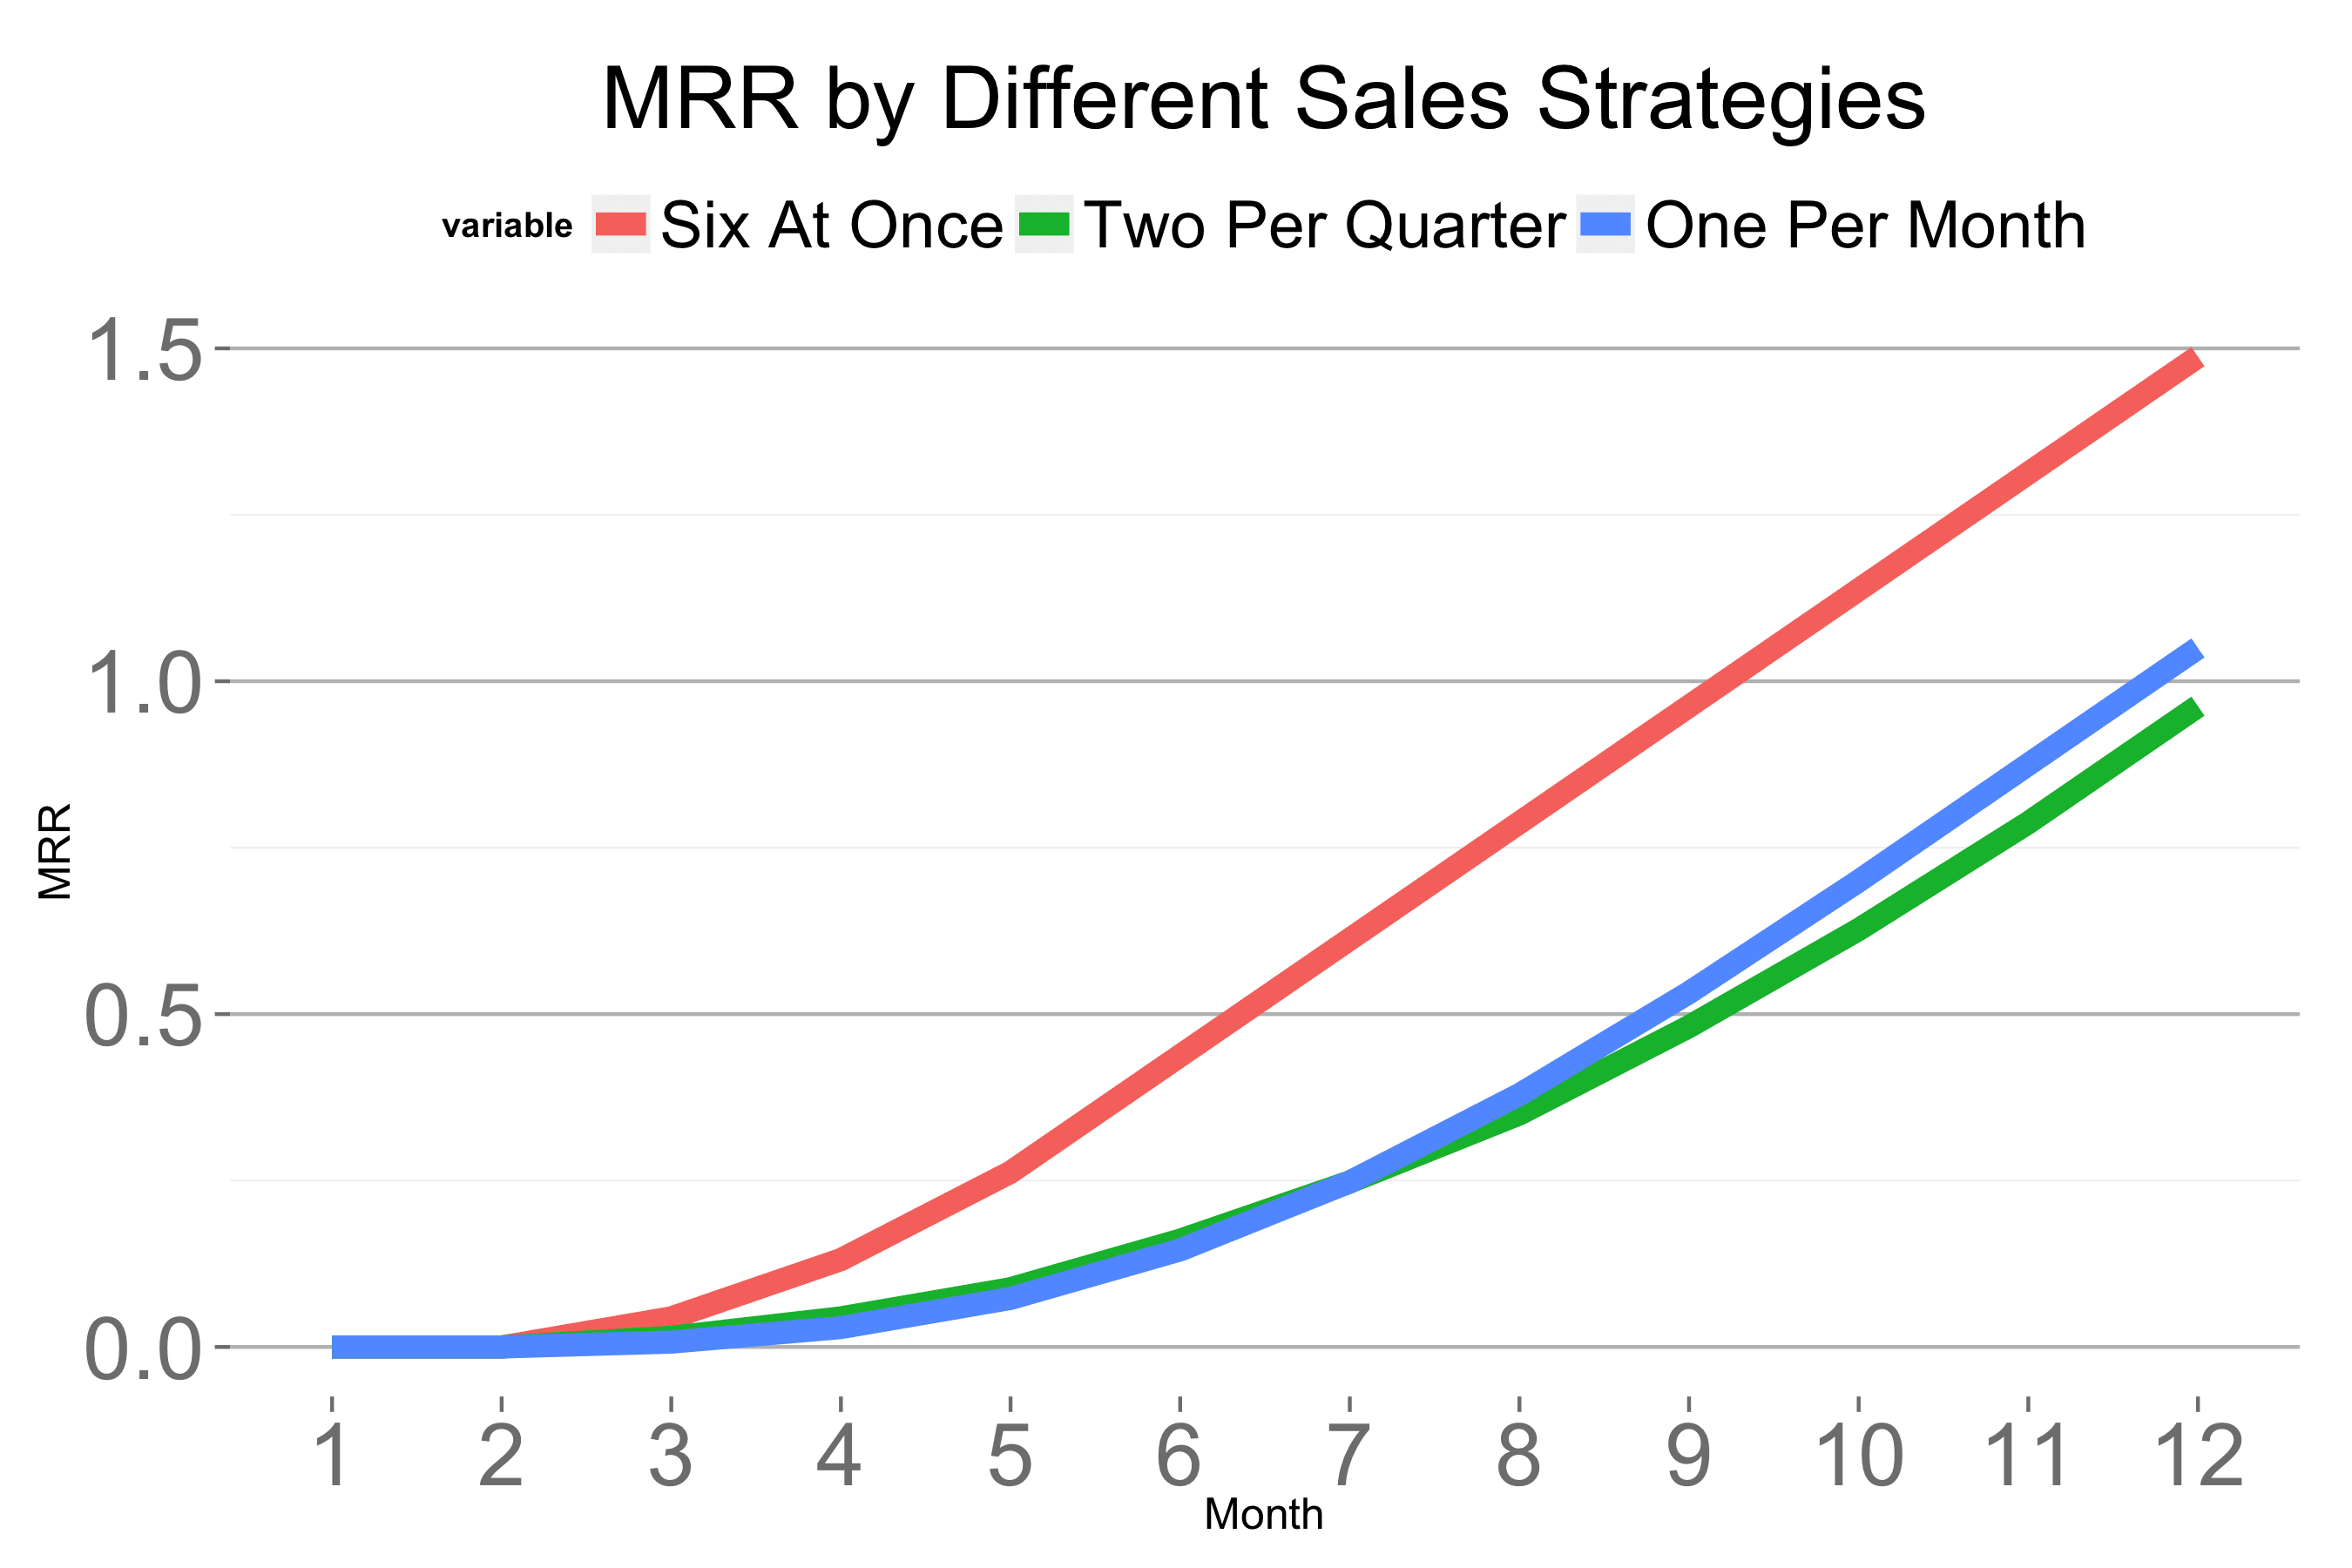
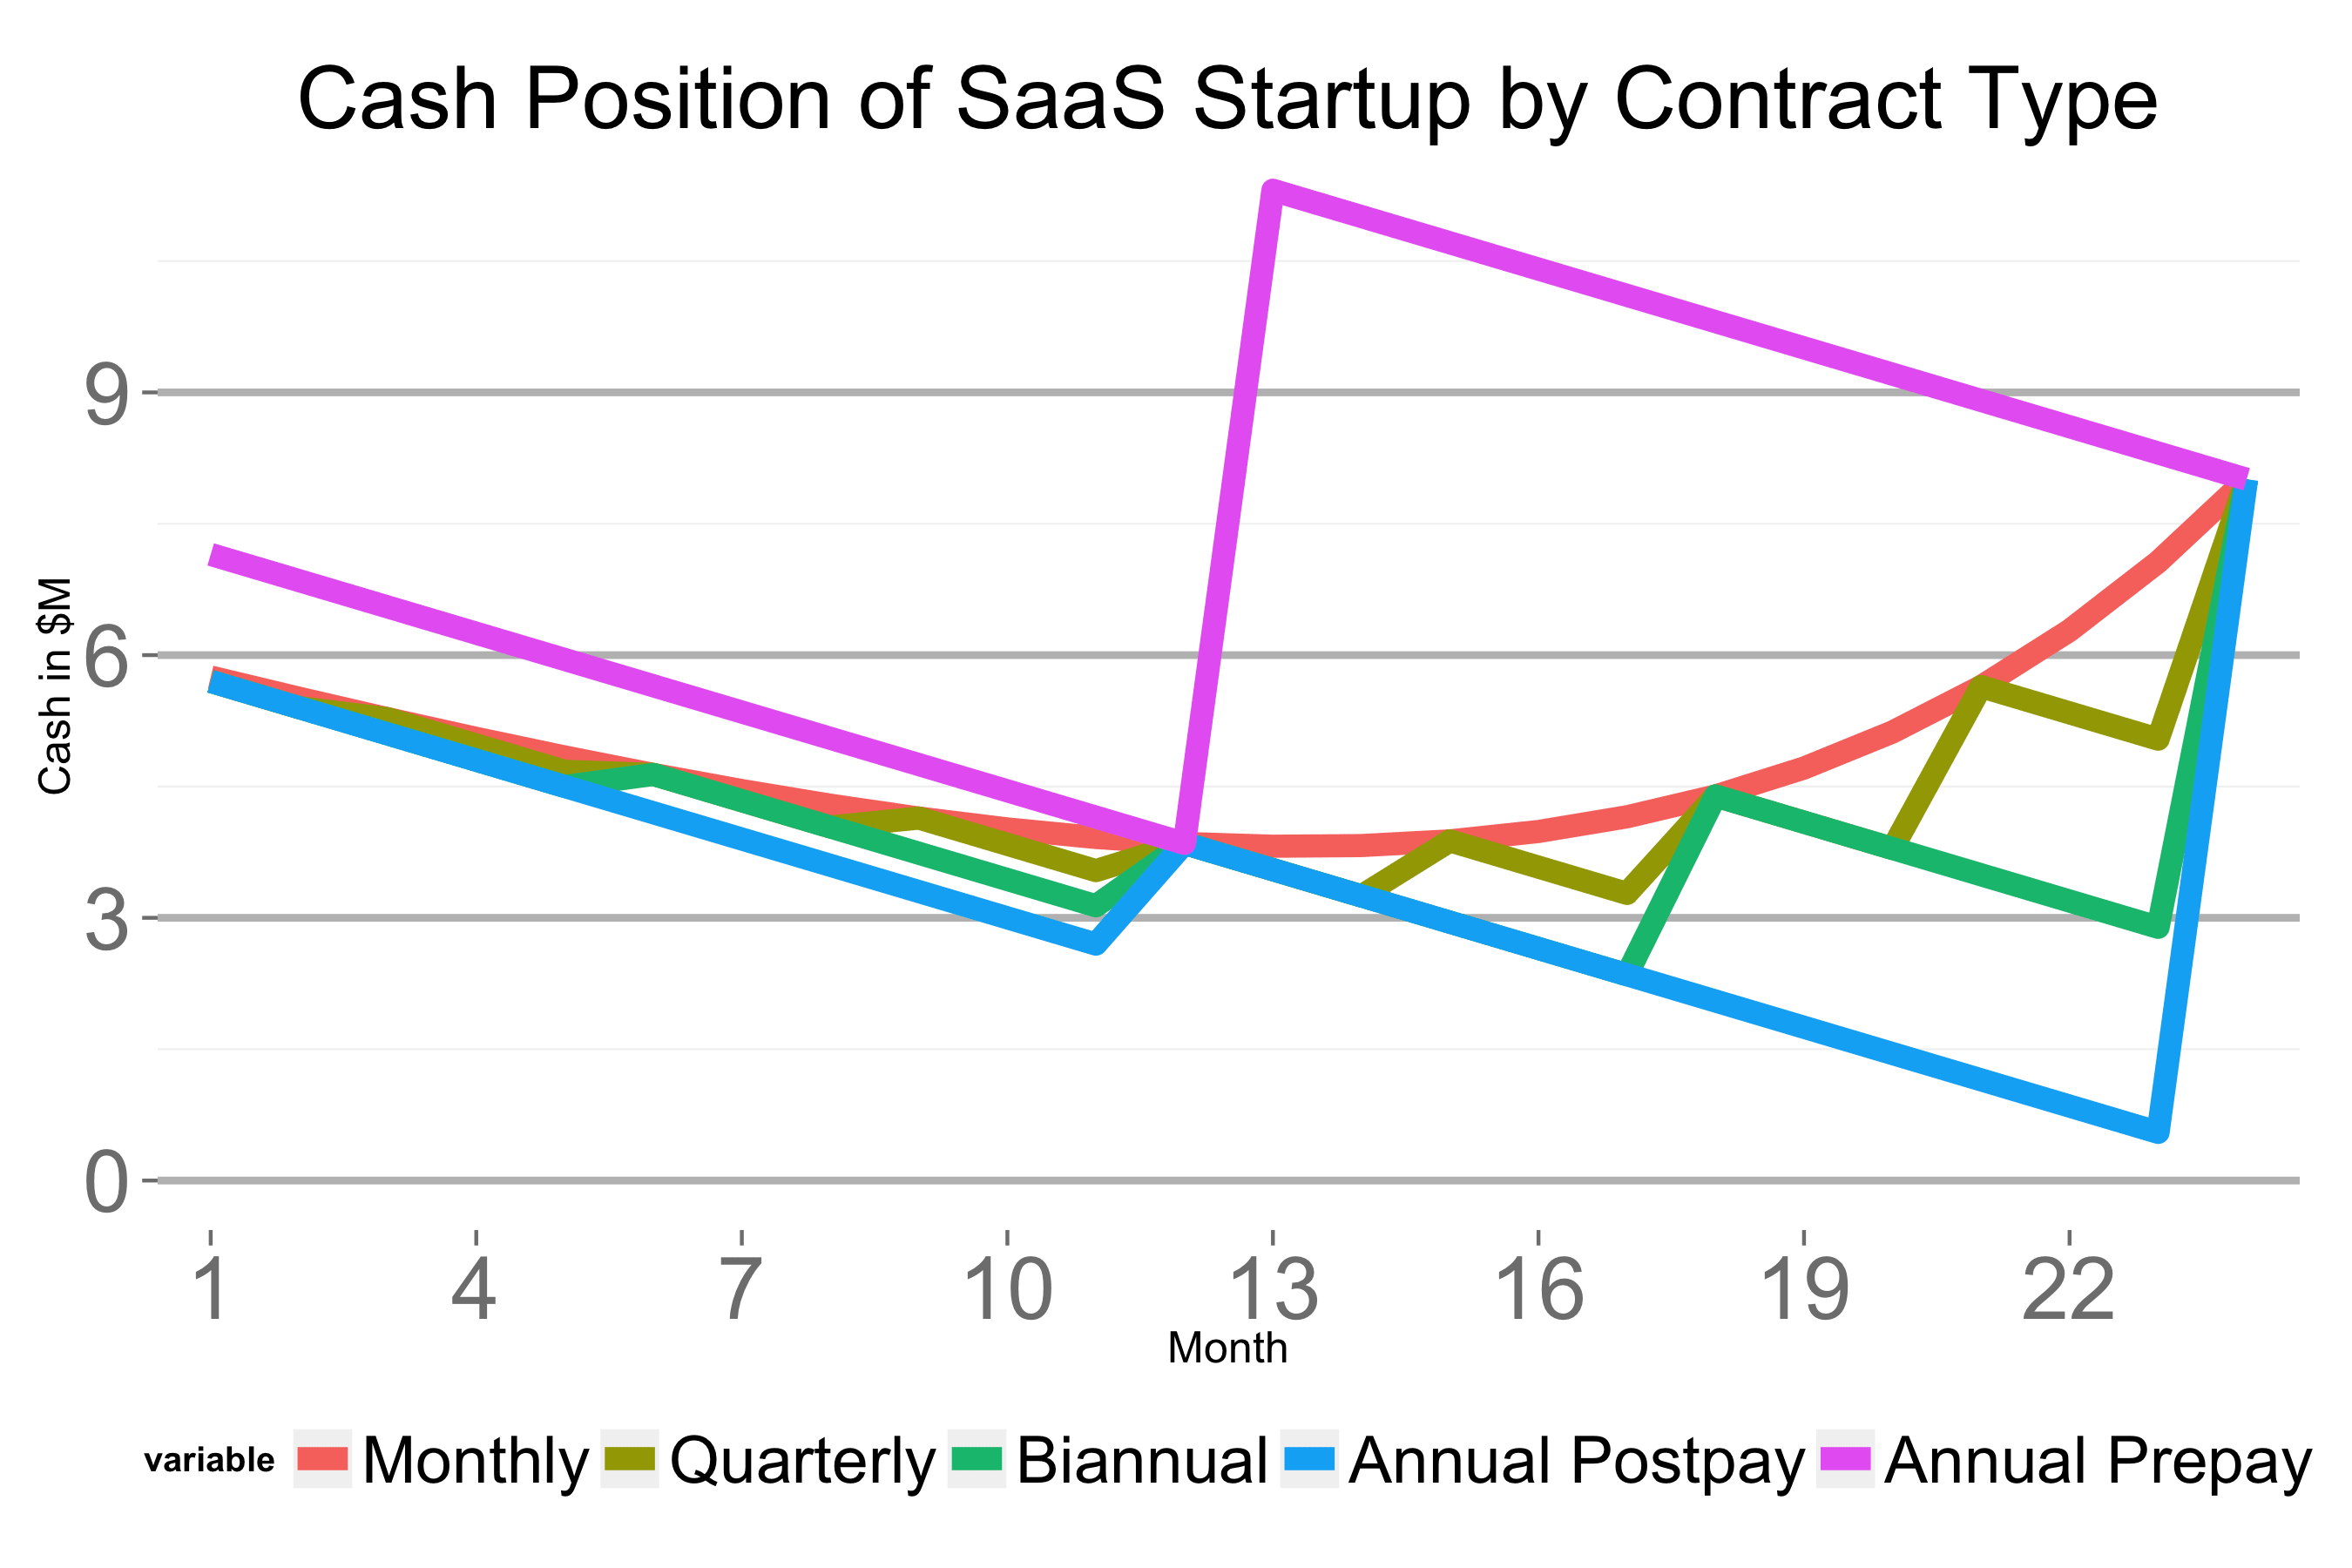
The Correction in SaaS Company Valuations
Analyzing the 23% decline in SaaS valuations: Why the market correction isn't as dramatic as it seems, backed by data showing 21% nine-month growth.
Explore how modern SaaS startups achieve 2x revenue-on-invested-capital vs 1998, with data showing increased capital efficiency for venture-backed companies.
Analyze Box's IPO metrics vs 40 public SaaS companies. Deep-dive into growth rates, revenue, and profitability data reveals key startup benchmarks at 9 years.
Discover the optimal monthly growth rate SaaS startups need to raise Series A funding, backed by real metrics and VC insights. Data-driven analysis for founders.
Discover the optimal cash levels for SaaS startups, from $7M seed funding to IPO. Data-driven analysis of balance sheets reveals key fundraising milestones.
Discover the revenue milestones SaaS startups need to hit for IPO success. Data from 41 public companies shows median path from $11M to $100M+ revenue.
Discover why SaaS companies now trade at 11x revenue vs 6x in 2006, with IPO timelines dropping from 12 to 7 years. Key data trends for startup founders.
Learn how successful SaaS startups drive user behavior change through product design, sales, and data. Key strategies to reduce churn and boost adoption.
Learn the 3 essential marketing skillsets every startup needs in a head of marketing: MarCom, quantitative, and product. A data-driven guide for founders hiring their first CMO.
Analyze the optimal customer value strategy for SaaS startups with real IPO data. Key finding: Revenue per customer shows only 0.3 R² correlation with total revenue.